
Welcome back.

Let’s join us
Reset password


Is This Bull Market Real?
With stocks nearing historic highs and banks revising their growth projections, it seems like the new bull market is well underway. But not everyone is so certain.

Heading 2
Paragraph
Heading 3
A rich text element can be used with static or dynamic content. For static content, just drop it into any page and begin editing. For dynamic content, add a rich text field to any collection and then connect a rich text element to that field in the settings panel. Voila!
Heading 4
Headings, paragraphs, blockquotes, figures, images, and figure captions can all be styled after a class is added to the rich text element using the "When inside of" nested selector system.
Heading 5
The bull market is back!
That’s what people are saying, anyway. The S&P 500 is back to within 5% of 2021's historical highs, the major banks are revising their growth projections upwards for Q4 and beyond, and inflation has been brought down to acceptable levels. It’s smooth sailing from here on out. Right?
Maybe. But some say that the enthusiasm building around this new bull market is nothing but a mirage - a ‘bull trap’. Bull traps are false signals that lead investors to believe that a negative trend has ended after a positive rally. This movement 'traps' investors in an asset that is likely to continue its sideways or negative trend.
The reality is that there are arguments to support both claims. In this article, we’ll take a look at both sides of the issue, as well as some time-tested strategies for strengthening your portfolio whether you’re bullish on this market or not.
The “America Is Back” Argument
As the former CEO of PIMCO, Mohamed El-Erian pointed out a decade ago, there is still only one game in town: central bank policy. In this regard, the United States Federal Reserve continues to provide monetary assistance to the national treasury and other financial institutions through debt instrument purchases and providing liquidity to market participants.

Numerous individuals with a “perma-bear” view have tried to predict the end date of this substantial issuance of dollars and debt by the financial system, which could potentially lead to a significant asset, debt, and equity price adjustment. However, such clarity has not materialized in the last 14 years, and sharp market declines were more attributable to the COVID-19 pandemic and regional bank crashes.
While acknowledging the existence of monetary issues can be beneficial, it might be unwise to ignore current market developments. Assuming that the last rally is not real or that monetary conditions will change overnight might not be the best approach.
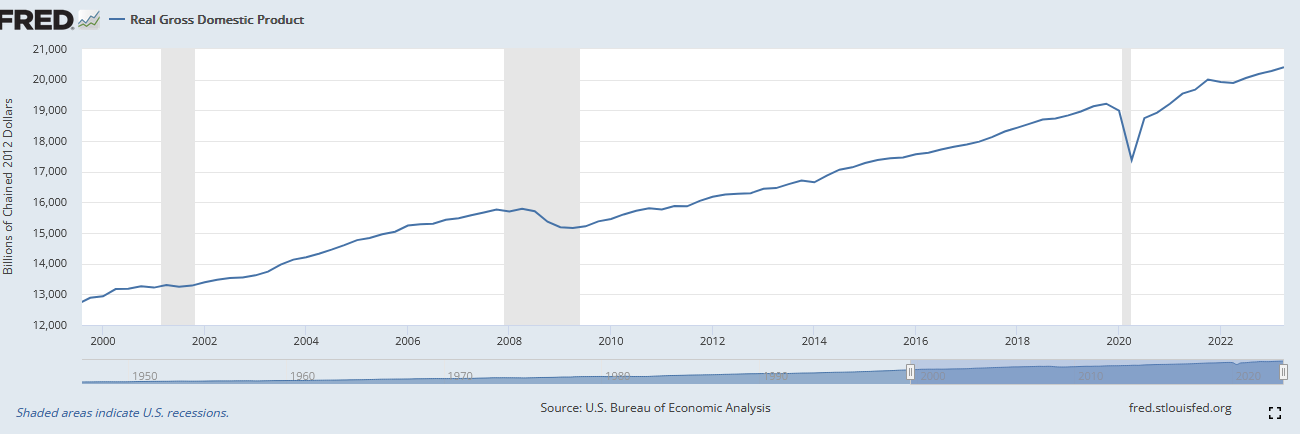
Regarding the real economy, we must also remember that all crises have an ending. Since the end of the COVID-19 pandemic, the economy has also experienced real growth and is at peak total GDP. Although much of this growth is leveraged by debt, interest rates in the U.S. have risen from 0.25% in 2020 to more than 5% in 2023 without causing a major economic crash.
Several major banks have recently revised their expectations for the remainder of 2023 and 2024. For example, in its latest report on American growth, Bank of America revealed that it no longer expects a mild recession in 2024 and now anticipates real gross domestic product to grow by an average of 2.0% this year, up from a previous forecast of 1.5%.
“Growth in economic activity over the past three quarters has averaged 2.3%, the unemployment rate has remained near all-time lows, and wage and price pressures are moving in the right direction, albeit gradually" - BofA
The same applies to Morgan Stanley, which has also adjusted its economic growth projection, foreseeing a "soft landing" scenario characterized by declining inflation without a recession or significant job losses. Additionally, both Citigroup and Goldman Sachs have raised their year-end target for the S&P 500.
As for the job market, the declining trend in recent years has not changed significantly. Unemployment remains near historical lows, at 3.6%. Numbers like these suggest the existence of frictional unemployment rather than a structural problem in this market.

So all systems are go, then? Not according to everyone.
The “Beware Of The Bull Trap” Argument
The first thing we must say about the current market values is that, while it is true that the S&P is approximately 5% below its historical highs, inflation since December 2021 has been 8.4%. Therefore, there is a nominal effect on the index value. The real adjustment from the 2021 highs is 12.2% when taking inflation into account. Additionally, there are multiple reasons to believe that this positive swing in the economic sentiment is overly concentrated in specific sectors.
The composition of the S&P is limited to only a handful of companies and industries. A clear example of this is that just 20 companies represent 36.04% of the entire index. Similarly, the technology, finance, and healthcare sectors account for 53.5% of the index. Can we really claim that the well-being of the entire economy is represented solely by the prices of 20 companies or just by 3 sectors?

Regarding the monetary stability of the system, we must mention that it is virtually impossible to sustain infinite debt. Uncontrolled money printing is starting to create inflation levels that have not been seen in the last 40 years. Many analysts believe that the "true" level of inflation is higher than what the government has disclosed.
One way inflation might be "hidden" is in the way many official statistics are calculated. Data provider Shadowstats calculates inflation using official methodologies used until 1990. This reduces the impact of factors like technological advancements and their weighting in the inflation calculation, both of which tend to lower headline inflation. On the other hand, it increases the influence of education or food prices.
According to Shadowstats, if we consider the methodology used until 1990, the real inflation in 2022 was above double digits and currently stands close to 8%, approximately twice the figure declared by the Bureau of Labor Statistics. All of this would mean that the real adjustment of the S&P is significantly more important than one might think at first.

Finally, we can mention that the famous Buffett Indicator, designed to "measure" how expensive or cheap the stock market is, is still in historically expensive territory. The Buffett Indicator is the ratio of the total United States stock market to GDP, and it currently stands at 182%. This means the market is almost twice the size of the US GDP. In short, the current bull market might exist but it might not be sustainable in the long run.

Conclusion
We’re not going to pretend to be stock market wizards, or to give any definite prediction about how the situation will unfold. But we will say this - while the fundamentals are strong, there are reasons to be skeptical of this new bull market. Investors would do well to look at assets that outperform in all economic environments.
Farmland is one of these assets. By accessing high-growth regions, farmowners can gain access to the kind of valuational increases that have defined farmland booms across history. Not to mention the 40% increase in the value of food since the end of the pandemic, and the opportunity to benefit from expanding trade relationships between developing countries and the United States.
Whether you’re bullish or bearish on this new market, diversification is a winning strategy. Use the link below to get in touch with our staff and learn more about how farmland ownership can strengthen your portfolio.
.png)


Gain insider access to Farmfolio's network.
Receive weekly insights and updates directly from Farmfolio.


